The Back button stays visible as you read. Use + to enlarge details.
B
BioMarco
FICTIONAL EXAMPLE
MICHAEL SMITH / 16 FEB 2026
Canada · Fasting
START HERE
Your results, in focus
Educational example • AI-assisted • 3 Nov 2026
1 / 7
Michael Smith · Age 52 · Male · Born 15 January 1974
1
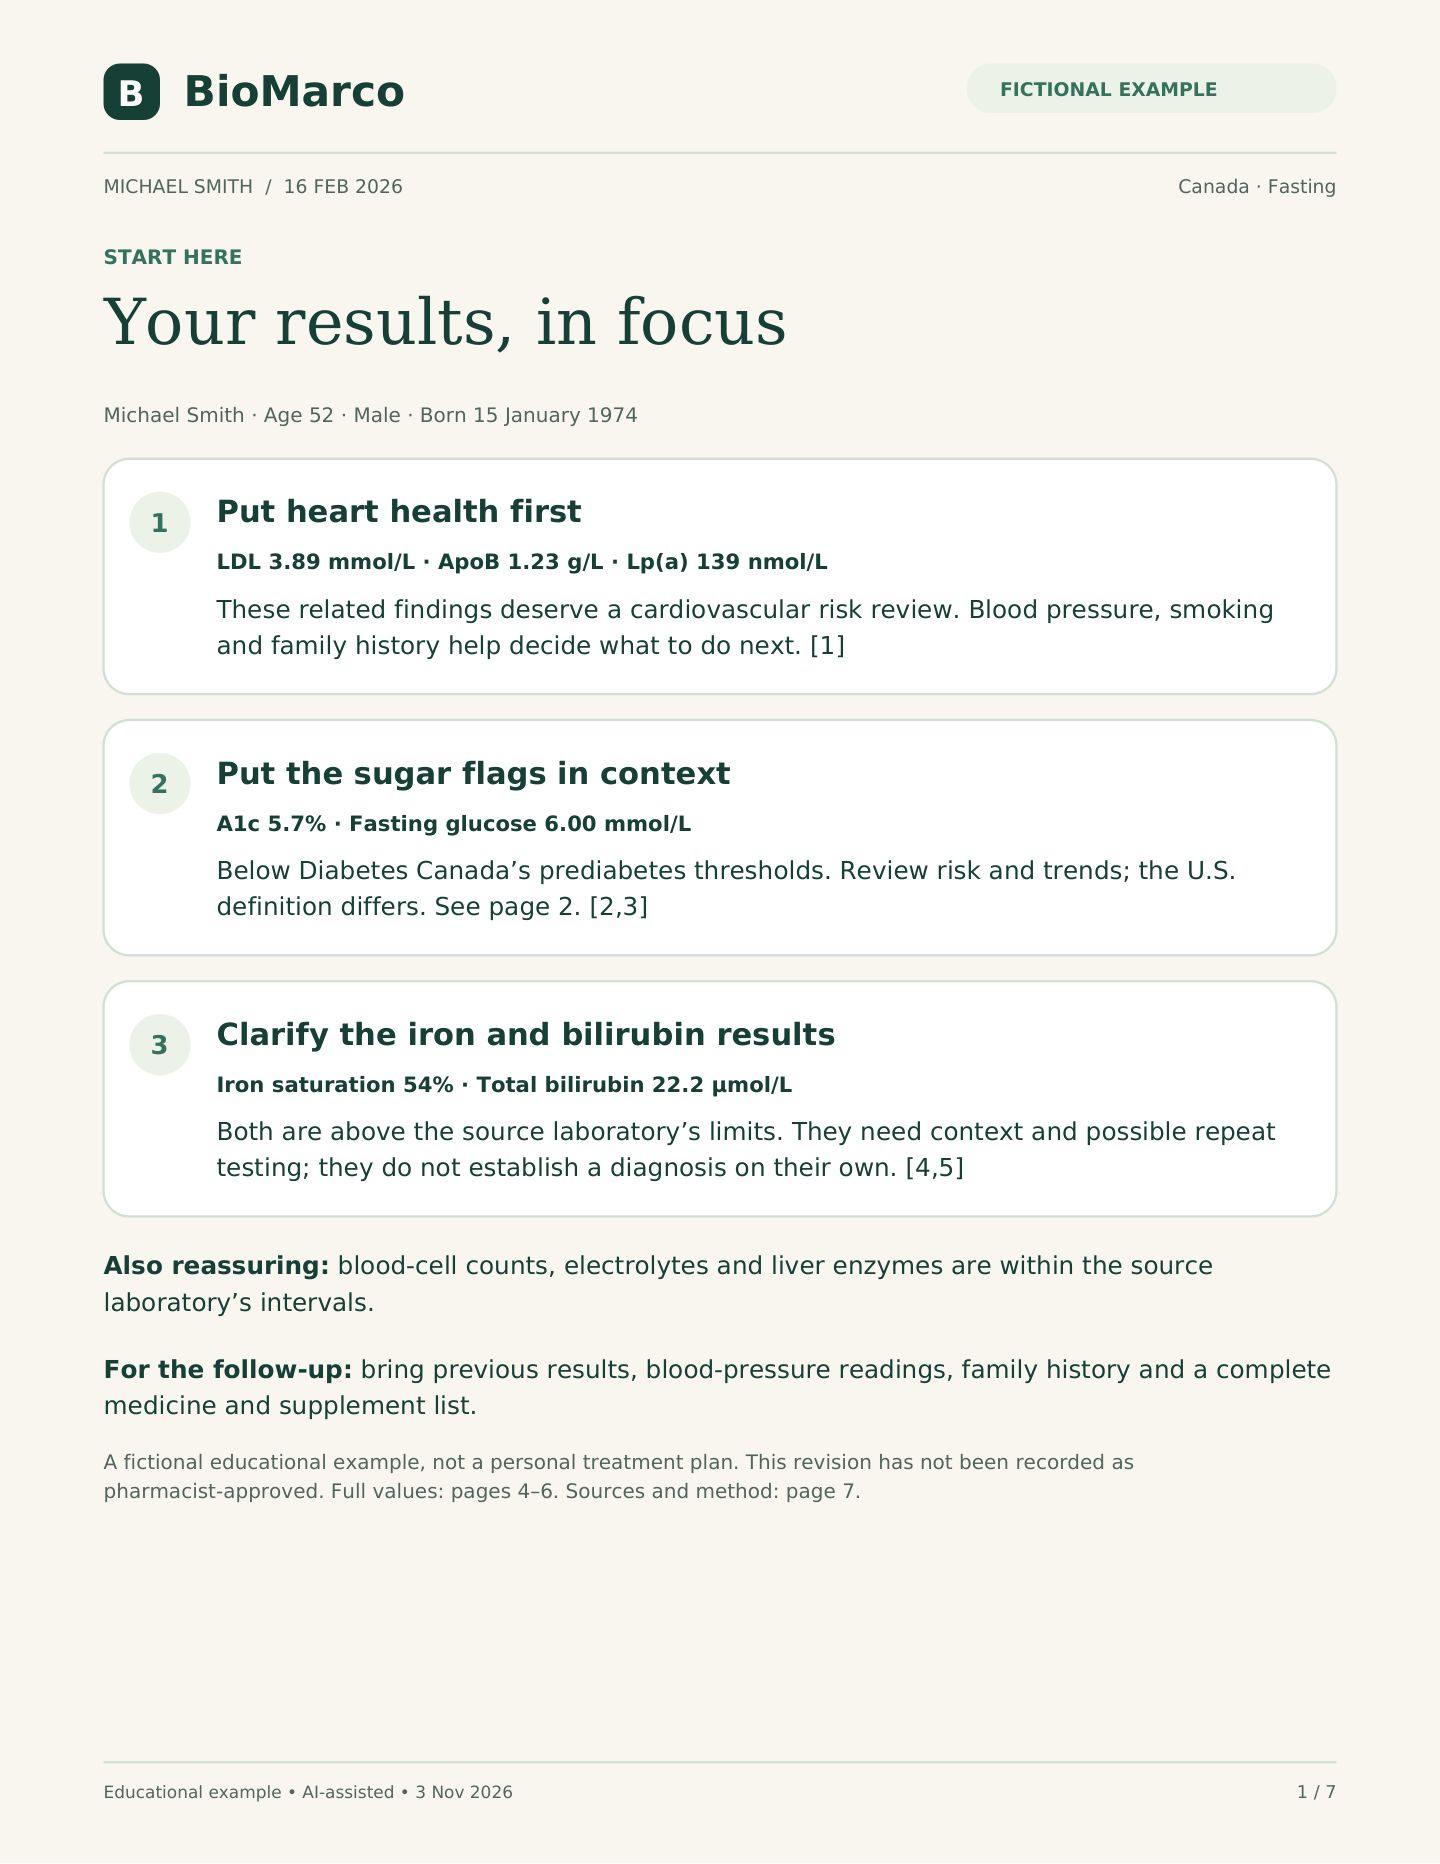
Put heart health first
LDL 3.89 mmol/L · ApoB 1.23 g/L · Lp(a) 139 nmol/L
These related findings deserve a cardiovascular risk review. Blood pressure, smoking
and family history help decide what to do next. [1]
2
Put the sugar flags in context
A1c 5.7% · Fasting glucose 6.00 mmol/L
Below Diabetes Canada’s prediabetes thresholds. Review risk and trends; the U.S.
definition differs. See page 2. [2,3]
3
Clarify the iron and bilirubin results
Iron saturation 54% · Total bilirubin 22.2 µmol/L
Both are above the source laboratory’s limits. They need context and possible repeat
testing; they do not establish a diagnosis on their own. [4,5]
Also reassuring: blood-cell counts, electrolytes and liver enzymes are within the source
laboratory’s intervals.
For the follow-up: bring previous results, blood-pressure readings, family history and a complete
medicine and supplement list.
A fictional educational example, not a personal treatment plan. This revision has not been recorded as
pharmacist-approved. Full values: pages 4–6. Sources and method: page 7.
B
BioMarco
FICTIONAL EXAMPLE
MICHAEL SMITH / 16 FEB 2026
Canada · Fasting
UNDERSTAND THE PRIORITIES
Heart health & blood sugar
Educational example • AI-assisted • 3 Nov 2026
2 / 7
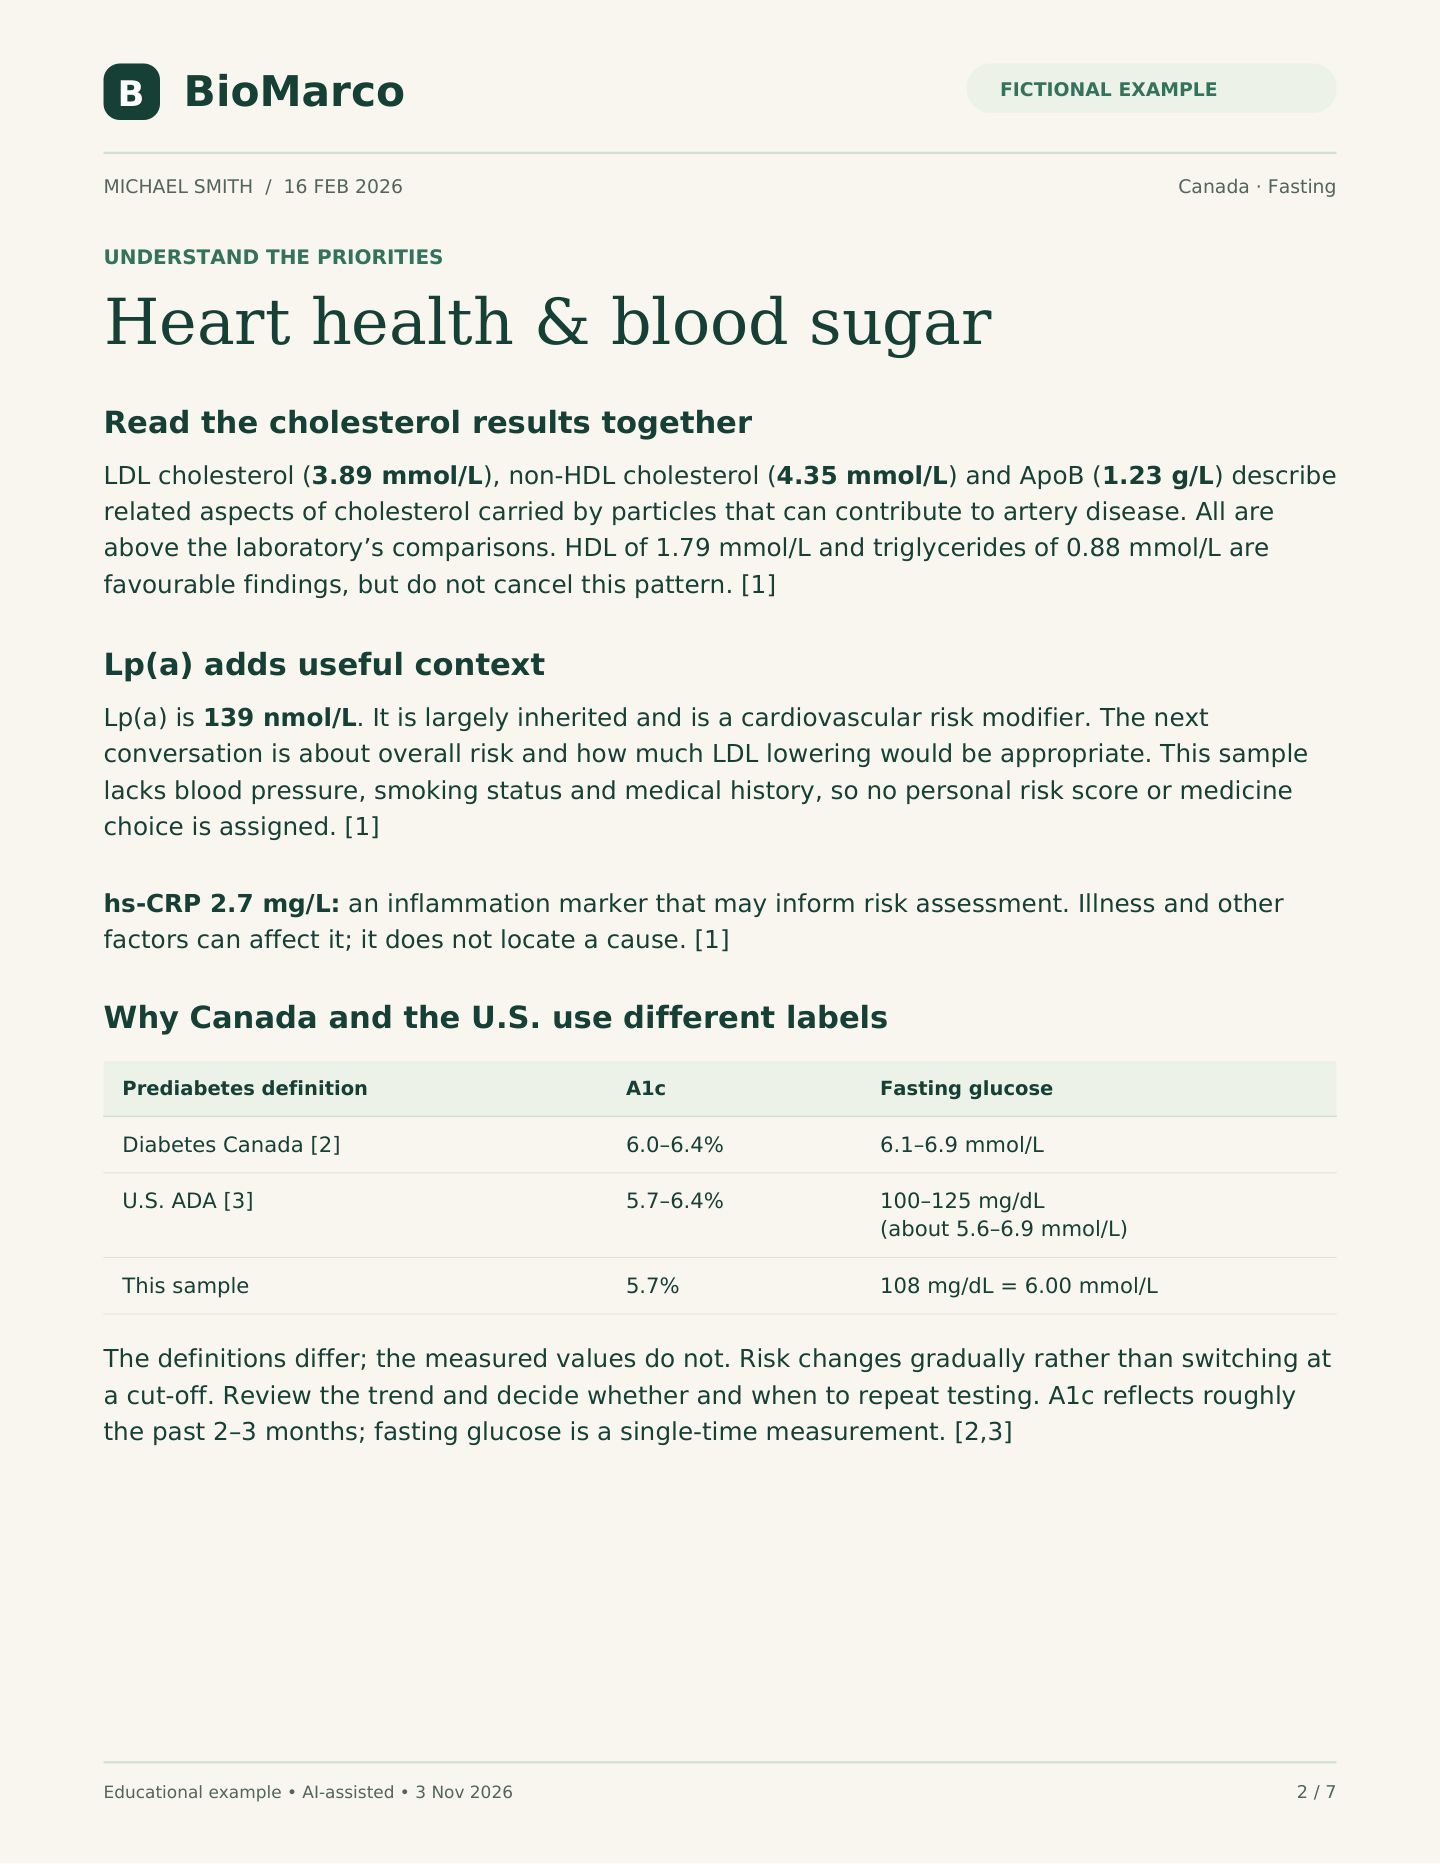
Read the cholesterol results together
LDL cholesterol (3.89 mmol/L), non-HDL cholesterol (4.35 mmol/L) and ApoB (1.23 g/L) describe
related aspects of cholesterol carried by particles that can contribute to artery disease. All are
above the laboratory’s comparisons. HDL of 1.79 mmol/L and triglycerides of 0.88 mmol/L are
favourable findings, but do not cancel this pattern. [1]
Lp(a) adds useful context
Lp(a) is 139 nmol/L. It is largely inherited and is a cardiovascular risk modifier. The next
conversation is about overall risk and how much LDL lowering would be appropriate. This sample
lacks blood pressure, smoking status and medical history, so no personal risk score or medicine
choice is assigned. [1]
hs-CRP 2.7 mg/L: an inflammation marker that may inform risk assessment. Illness and other
factors can affect it; it does not locate a cause. [1]
Why Canada and the U.S. use different labels
Prediabetes definition
A1c
Fasting glucose
Diabetes Canada [2]
6.0–6.4%
6.1–6.9 mmol/L
U.S. ADA [3]
5.7–6.4%
100–125 mg/dL
(about 5.6–6.9 mmol/L)
This sample
5.7%
108 mg/dL = 6.00 mmol/L
The definitions differ; the measured values do not. Risk changes gradually rather than switching at
a cut-off. Review the trend and decide whether and when to repeat testing. A1c reflects roughly
the past 2–3 months; fasting glucose is a single-time measurement. [2,3]
B
BioMarco
FICTIONAL EXAMPLE
MICHAEL SMITH / 16 FEB 2026
Canada · Fasting
A FOCUSED FOLLOW-UP
What to clarify next
Educational example • AI-assisted • 3 Nov 2026
3 / 7
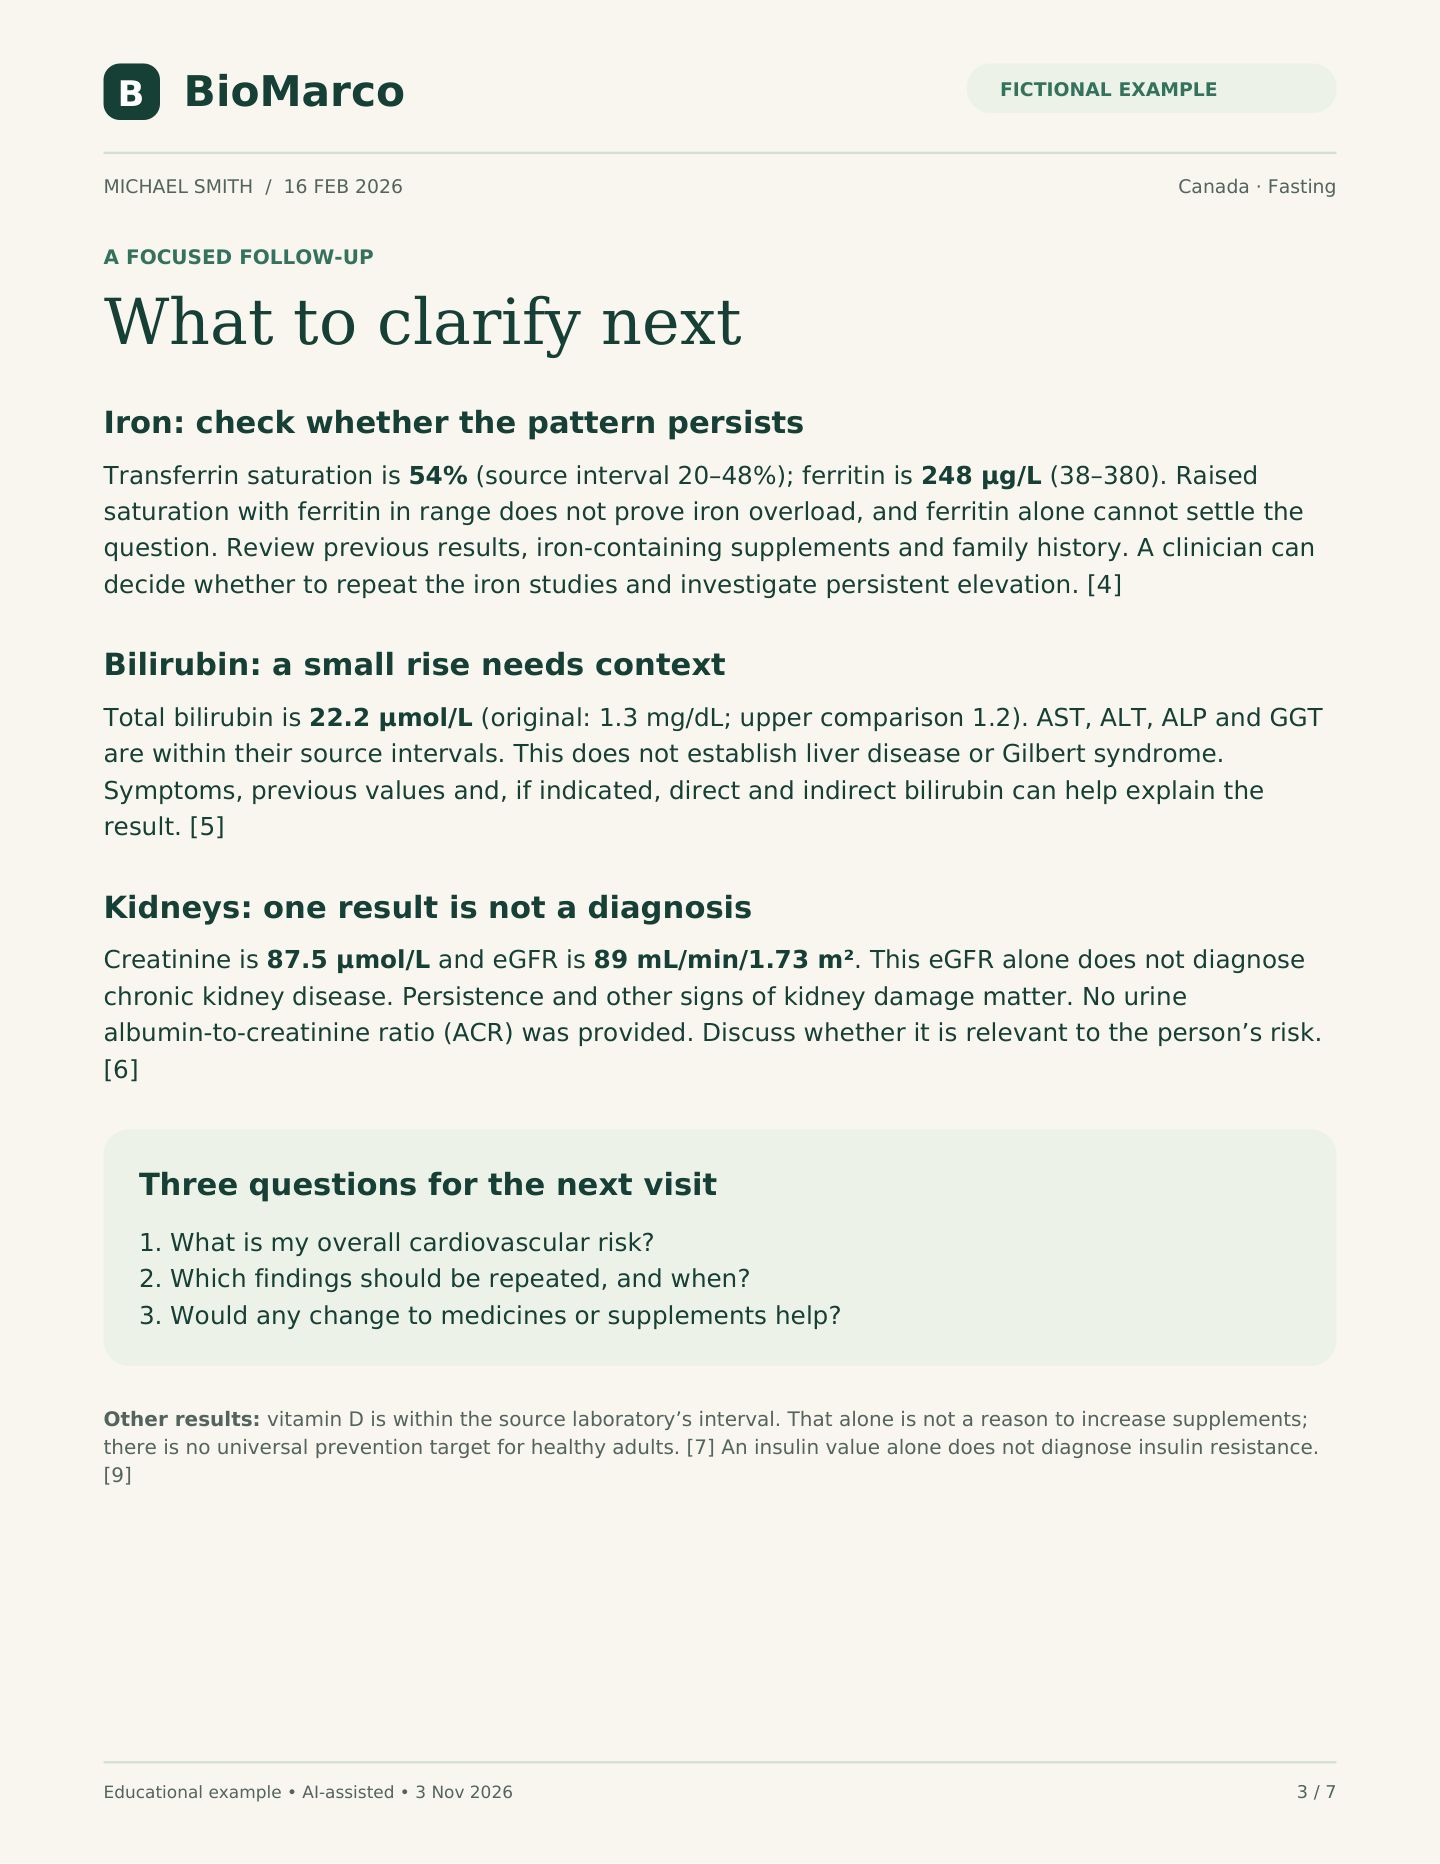
Iron: check whether the pattern persists
Transferrin saturation is 54% (source interval 20–48%); ferritin is 248 µg/L (38–380). Raised
saturation with ferritin in range does not prove iron overload, and ferritin alone cannot settle the
question. Review previous results, iron-containing supplements and family history. A clinician can
decide whether to repeat the iron studies and investigate persistent elevation. [4]
Bilirubin: a small rise needs context
Total bilirubin is 22.2 µmol/L (original: 1.3 mg/dL; upper comparison 1.2). AST, ALT, ALP and GGT
are within their source intervals. This does not establish liver disease or Gilbert syndrome.
Symptoms, previous values and, if indicated, direct and indirect bilirubin can help explain the
result. [5]
Kidneys: one result is not a diagnosis
Creatinine is 87.5 µmol/L and eGFR is 89 mL/min/1.73 m². This eGFR alone does not diagnose
chronic kidney disease. Persistence and other signs of kidney damage matter. No urine
albumin-to-creatinine ratio (ACR) was provided. Discuss whether it is relevant to the person’s risk.
[6]
Three questions for the next visit
1. What is my overall cardiovascular risk?
2. Which findings should be repeated, and when?
3. Would any change to medicines or supplements help?
Other results: vitamin D is within the source laboratory’s interval. That alone is not a reason to increase supplements;
there is no universal prevention target for healthy adults. [7] An insulin value alone does not diagnose insulin resistance.
[9]
B
BioMarco
FICTIONAL EXAMPLE
MICHAEL SMITH / 16 FEB 2026
Canada · Fasting
CANADIAN UNITS
Results · part 1
Educational example • AI-assisted • 3 Nov 2026
4 / 7
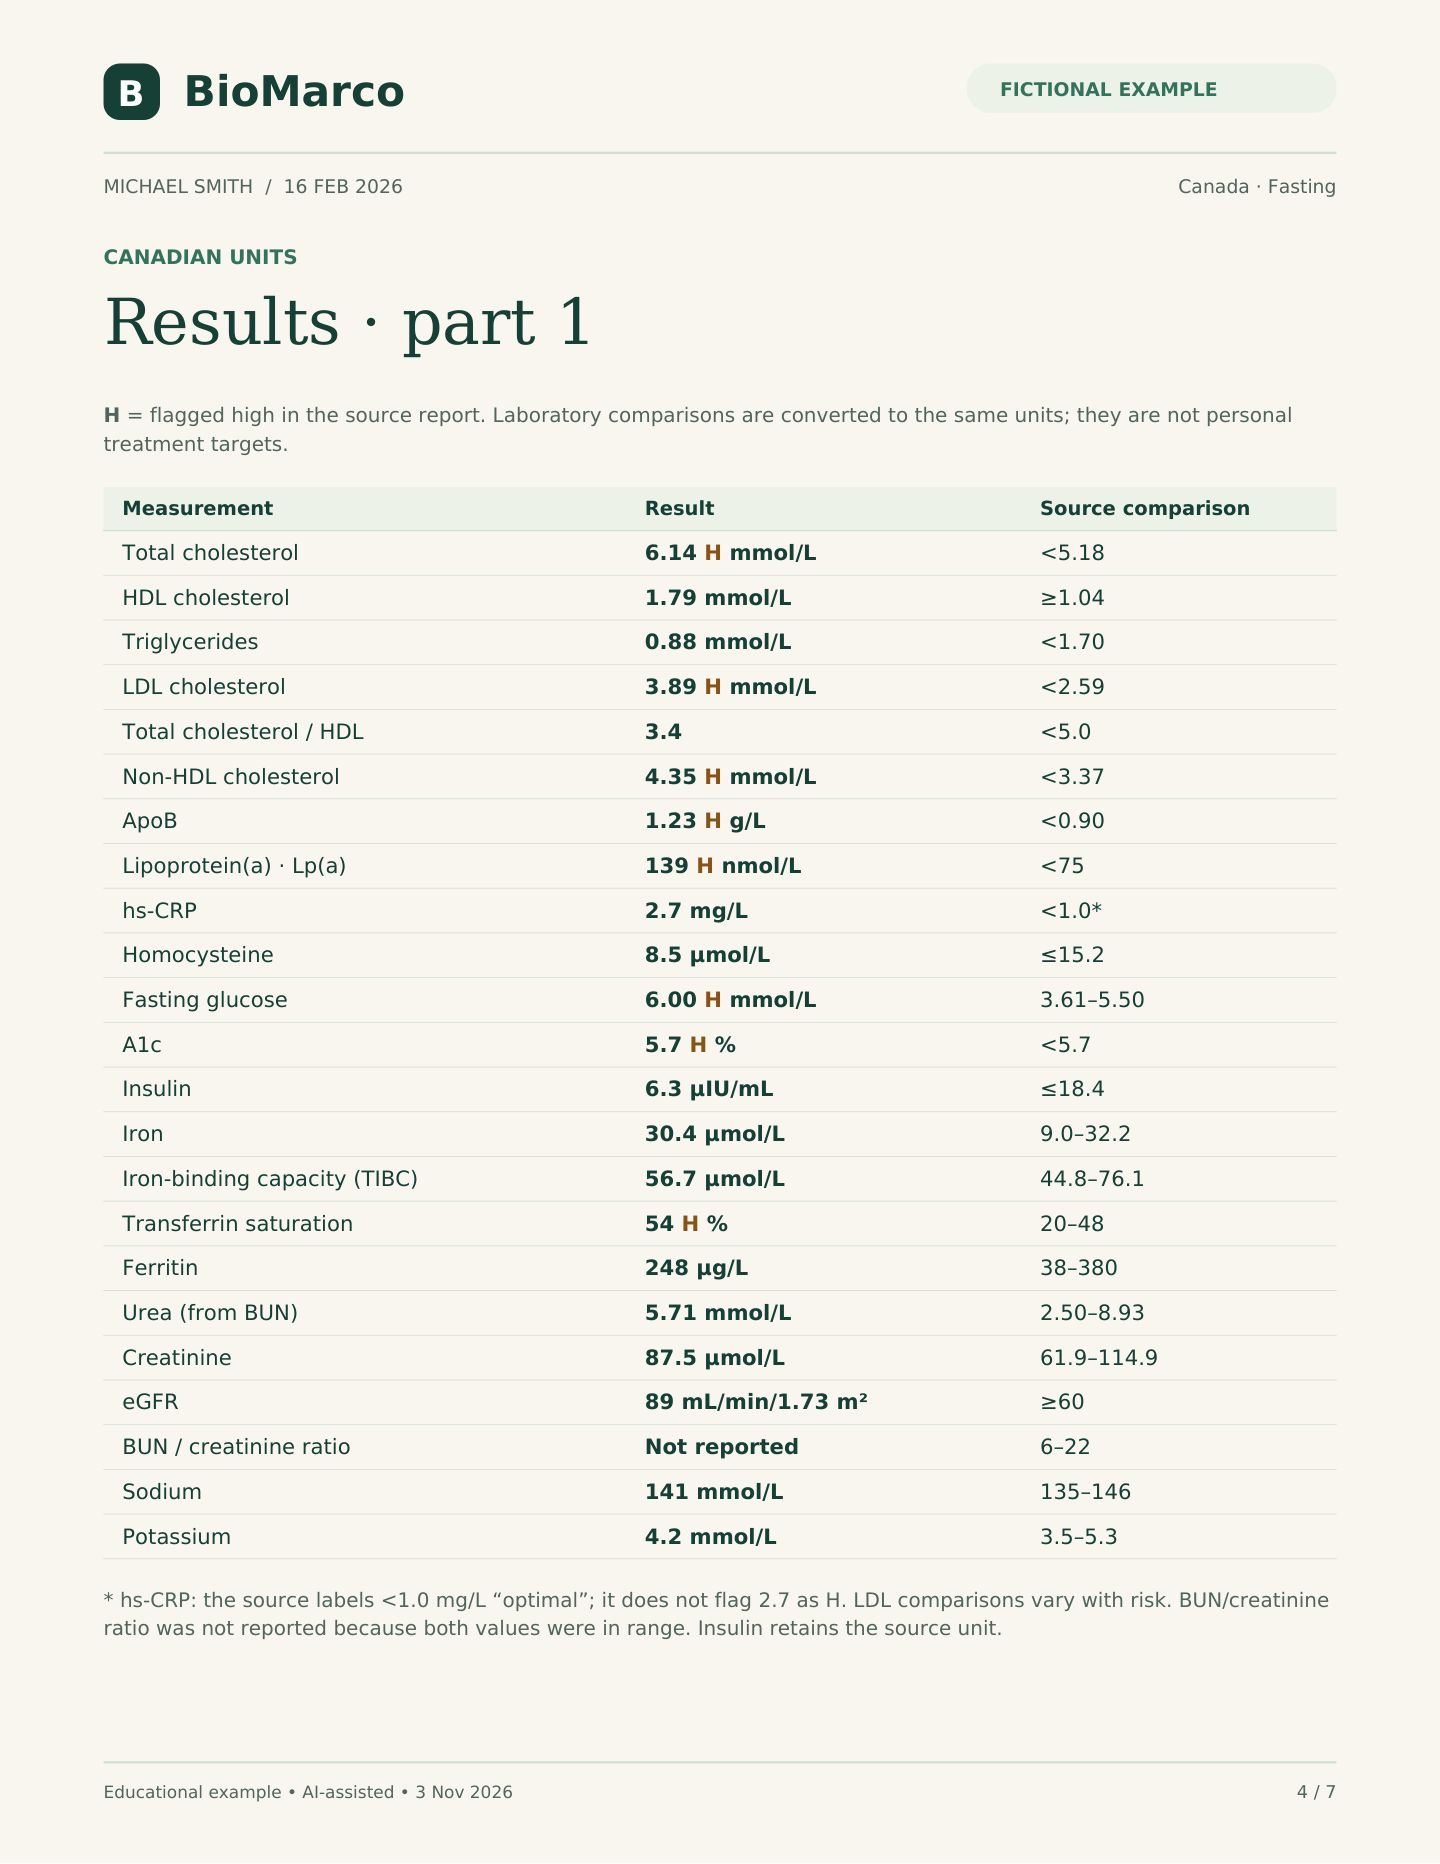
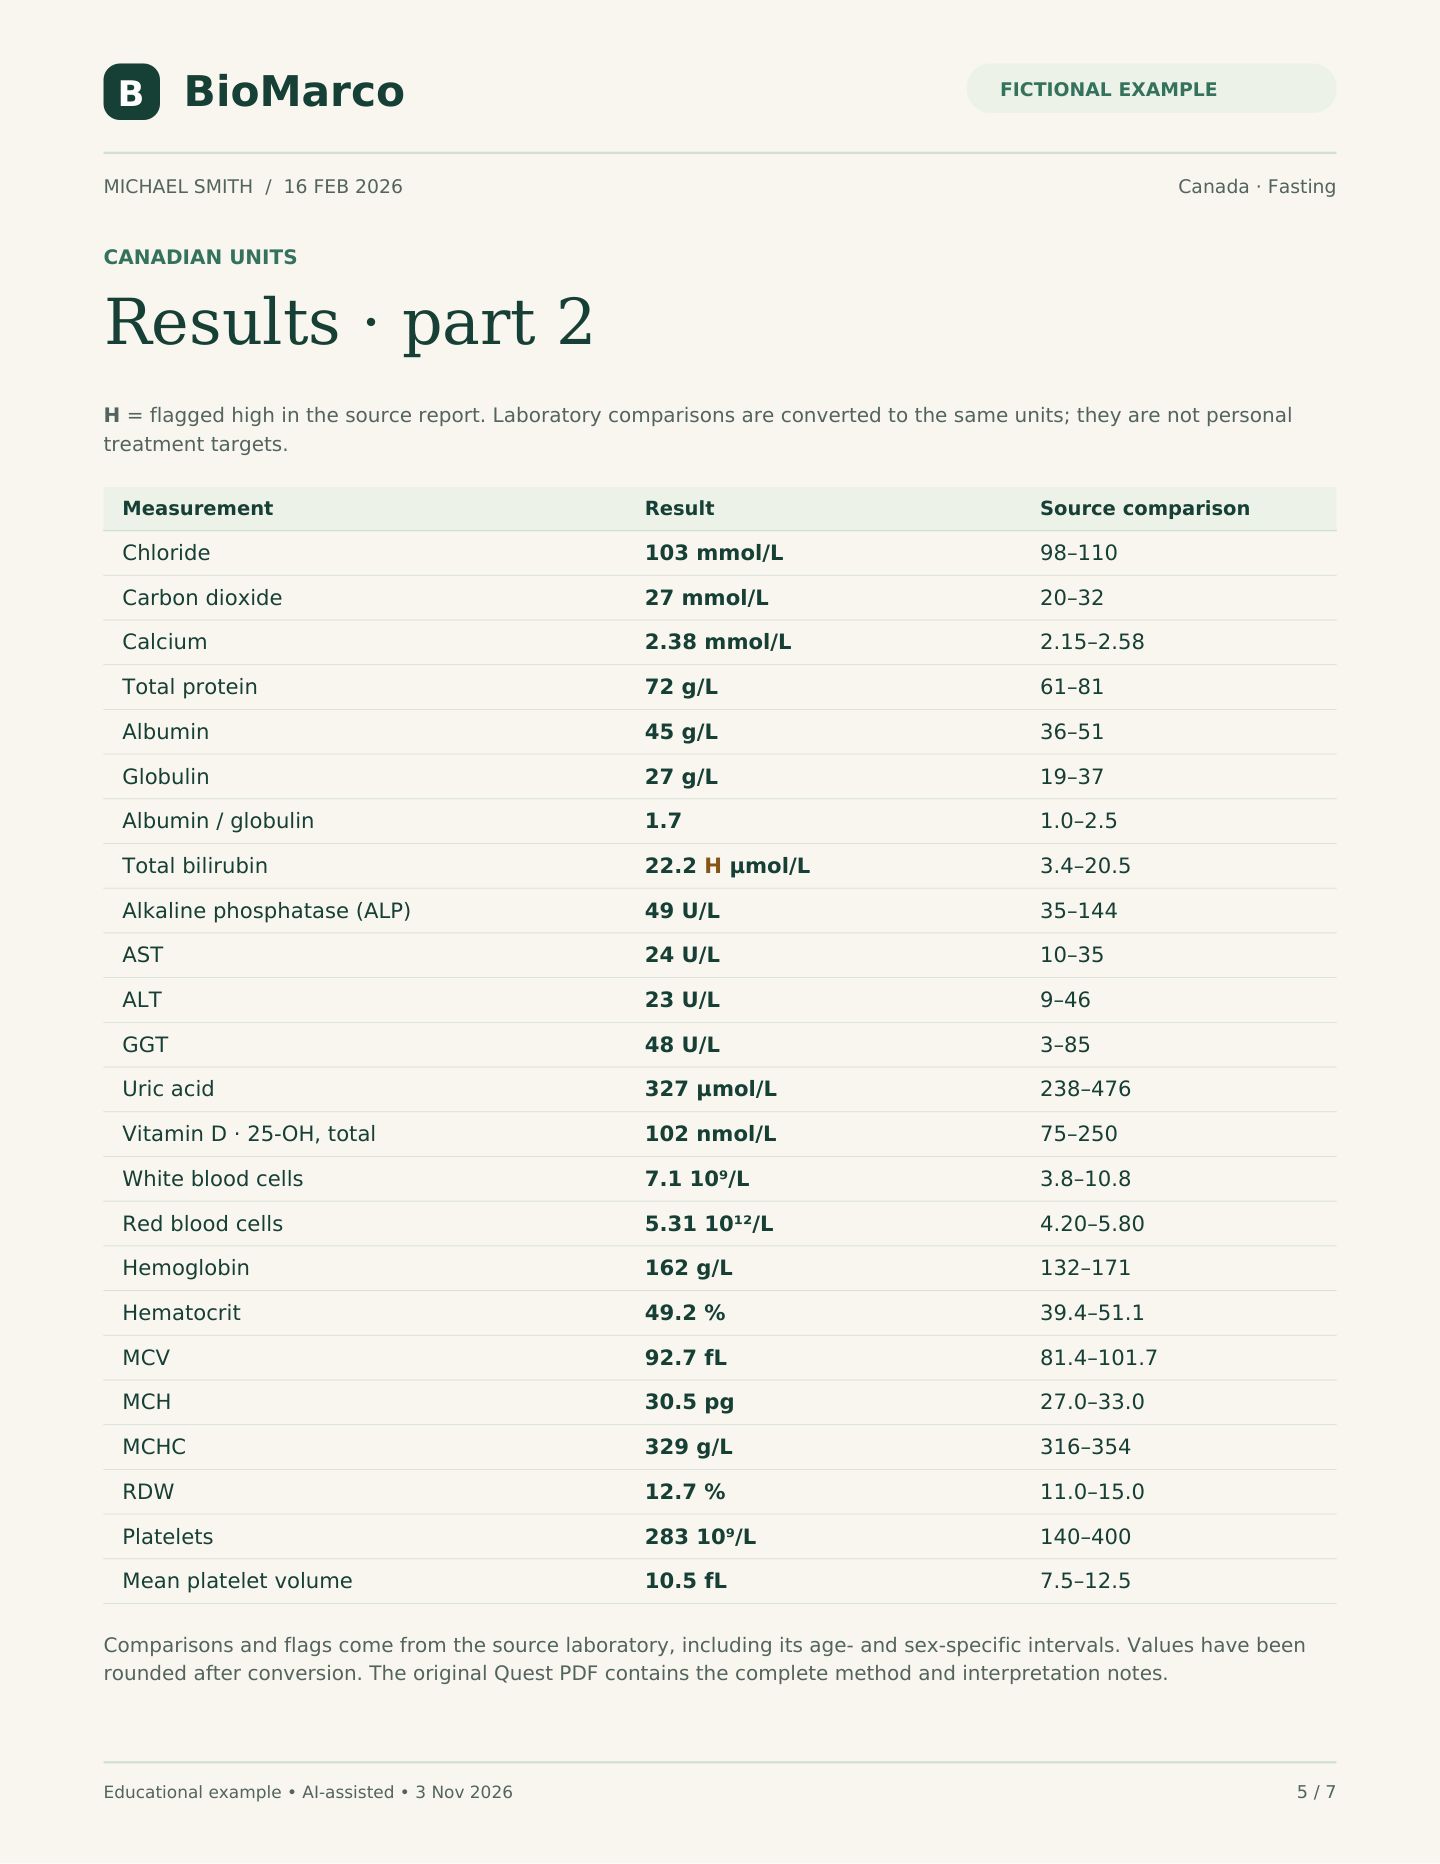
H = flagged high in the source report. Laboratory comparisons are converted to the same units; they are not personal
treatment targets.
Measurement
Result
Source comparison
Total cholesterol
6.14 H mmol/L
<5.18
HDL cholesterol
1.79 mmol/L
≥1.04
Triglycerides
0.88 mmol/L
<1.70
LDL cholesterol
3.89 H mmol/L
<2.59
Total cholesterol / HDL
3.4
<5.0
Non-HDL cholesterol
4.35 H mmol/L
<3.37
ApoB
1.23 H g/L
<0.90
Lipoprotein(a) · Lp(a)
139 H nmol/L
<75
hs-CRP
2.7 mg/L
<1.0*
Homocysteine
8.5 µmol/L
≤15.2
Fasting glucose
6.00 H mmol/L
3.61–5.50
A1c
5.7 H %
<5.7
Insulin
6.3 µIU/mL
≤18.4
Iron
30.4 µmol/L
9.0–32.2
Iron-binding capacity (TIBC)
56.7 µmol/L
44.8–76.1
Transferrin saturation
54 H %
20–48
Ferritin
248 µg/L
38–380
Urea (from BUN)
5.71 mmol/L
2.50–8.93
Creatinine
87.5 µmol/L
61.9–114.9
eGFR
89 mL/min/1.73 m²
≥60
BUN / creatinine ratio
Not reported
6–22
Sodium
141 mmol/L
135–146
Potassium
4.2 mmol/L
3.5–5.3
* hs-CRP: the source labels <1.0 mg/L “optimal”; it does not flag 2.7 as H. LDL comparisons vary with risk. BUN/creatinine
ratio was not reported because both values were in range. Insulin retains the source unit.
B
BioMarco
FICTIONAL EXAMPLE
MICHAEL SMITH / 16 FEB 2026
Canada · Fasting
CANADIAN UNITS
Results · part 2
Educational example • AI-assisted • 3 Nov 2026
5 / 7
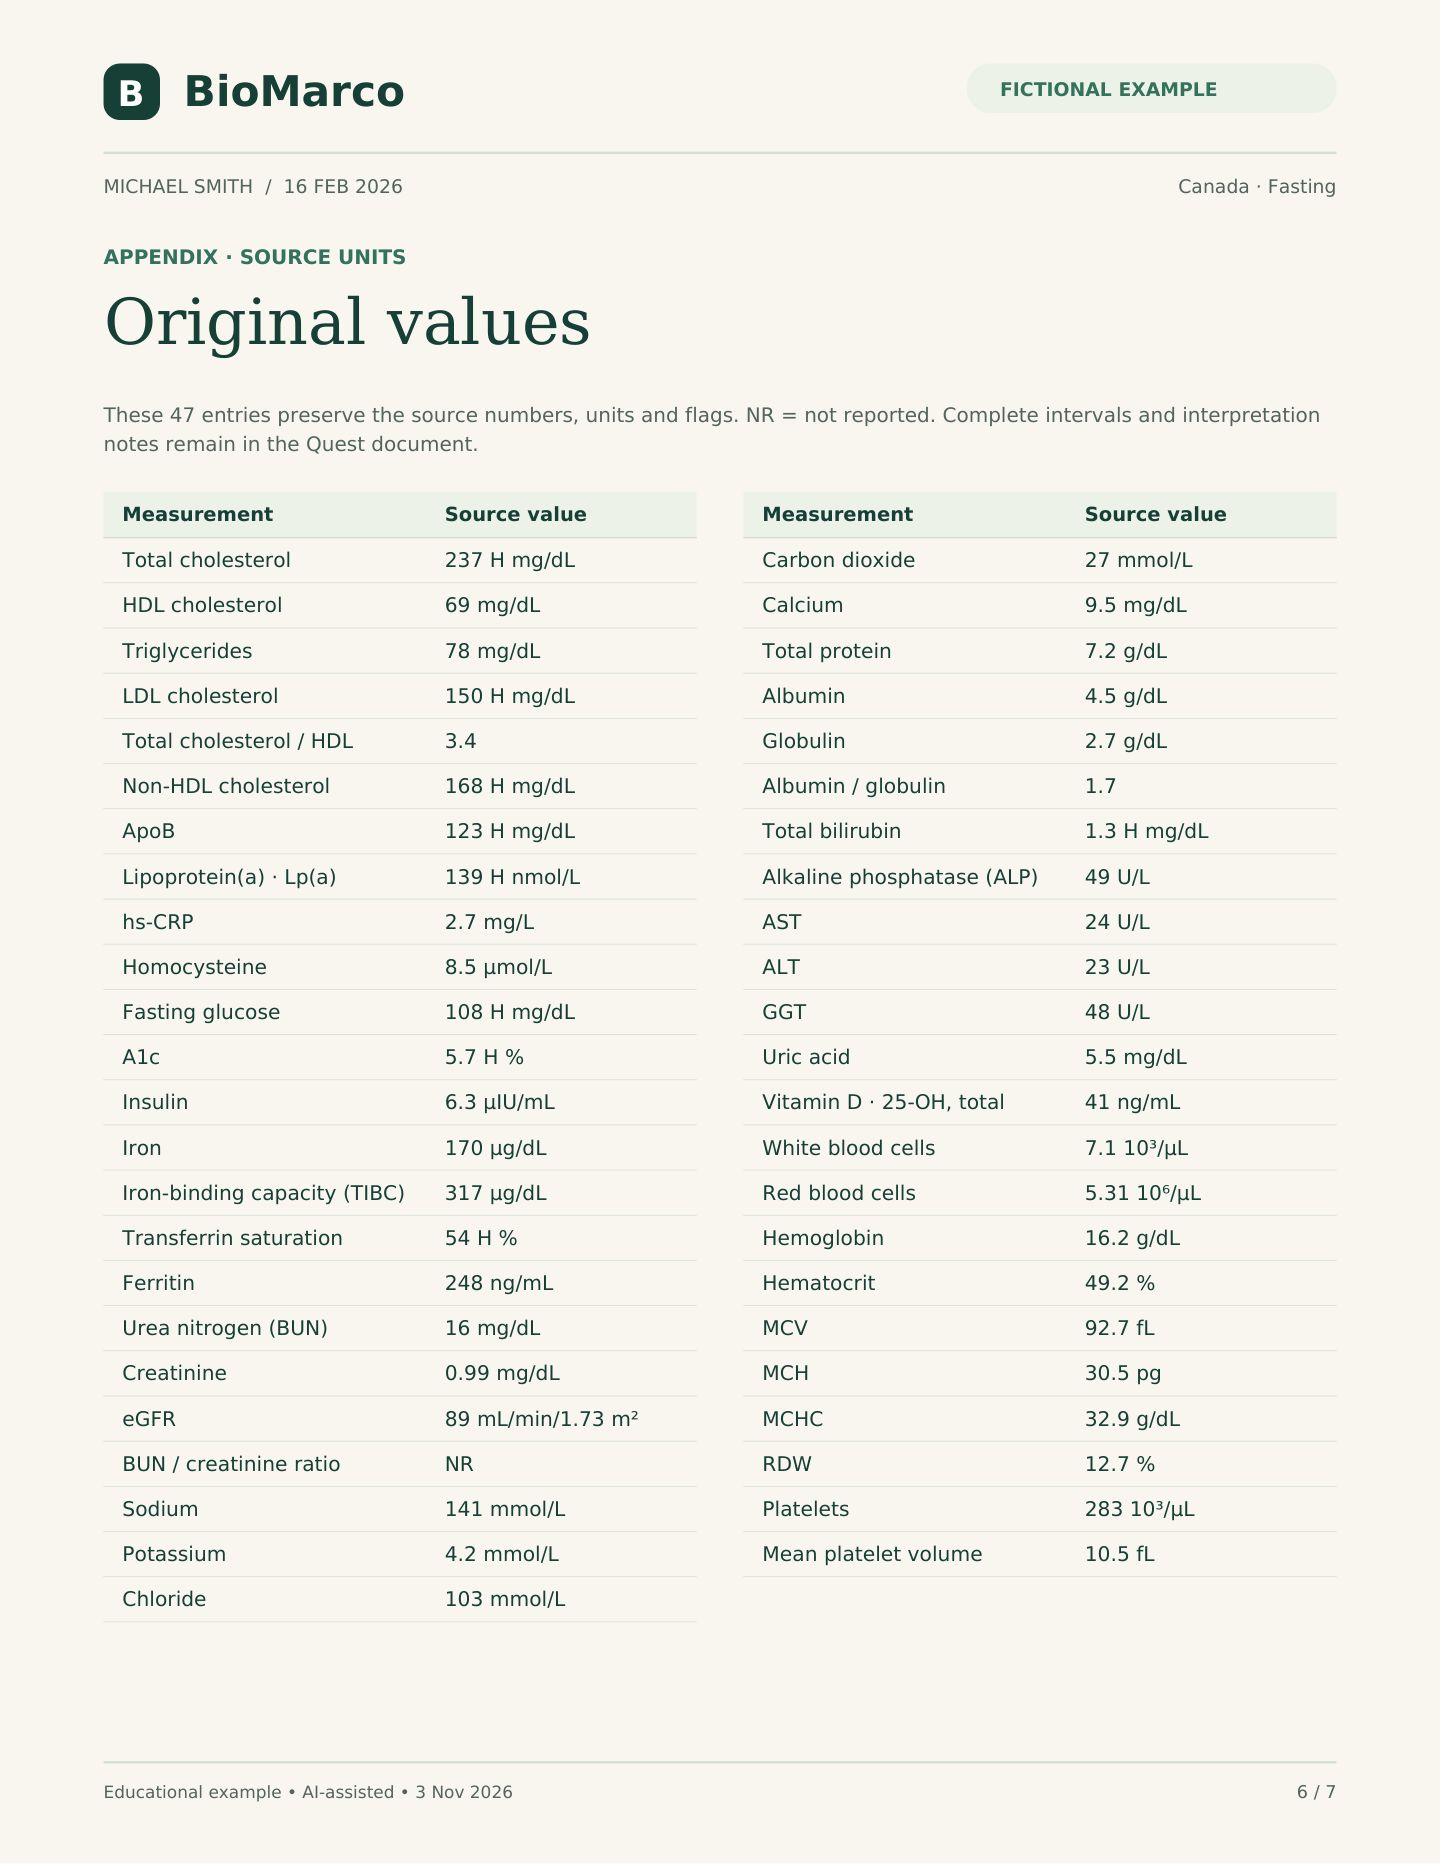
H = flagged high in the source report. Laboratory comparisons are converted to the same units; they are not personal
treatment targets.
Measurement
Result
Source comparison
Chloride
103 mmol/L
98–110
Carbon dioxide
27 mmol/L
20–32
Calcium
2.38 mmol/L
2.15–2.58
Total protein
72 g/L
61–81
Albumin
45 g/L
36–51
Globulin
27 g/L
19–37
Albumin / globulin
1.7
1.0–2.5
Total bilirubin
22.2 H µmol/L
3.4–20.5
Alkaline phosphatase (ALP)
49 U/L
35–144
AST
24 U/L
10–35
ALT
23 U/L
9–46
GGT
48 U/L
3–85
Uric acid
327 µmol/L
238–476
Vitamin D · 25-OH, total
102 nmol/L
75–250
White blood cells
7.1 10⁹/L
3.8–10.8
Red blood cells
5.31 10¹²/L
4.20–5.80
Hemoglobin
162 g/L
132–171
Hematocrit
49.2 %
39.4–51.1
MCV
92.7 fL
81.4–101.7
MCH
30.5 pg
27.0–33.0
MCHC
329 g/L
316–354
RDW
12.7 %
11.0–15.0
Platelets
283 10⁹/L
140–400
Mean platelet volume
10.5 fL
7.5–12.5
Comparisons and flags come from the source laboratory, including its age- and sex-specific intervals. Values have been
rounded after conversion. The original Quest PDF contains the complete method and interpretation notes.
B
BioMarco
FICTIONAL EXAMPLE
MICHAEL SMITH / 16 FEB 2026
Canada · Fasting
APPENDIX · SOURCE UNITS
Original values
Educational example • AI-assisted • 3 Nov 2026
6 / 7
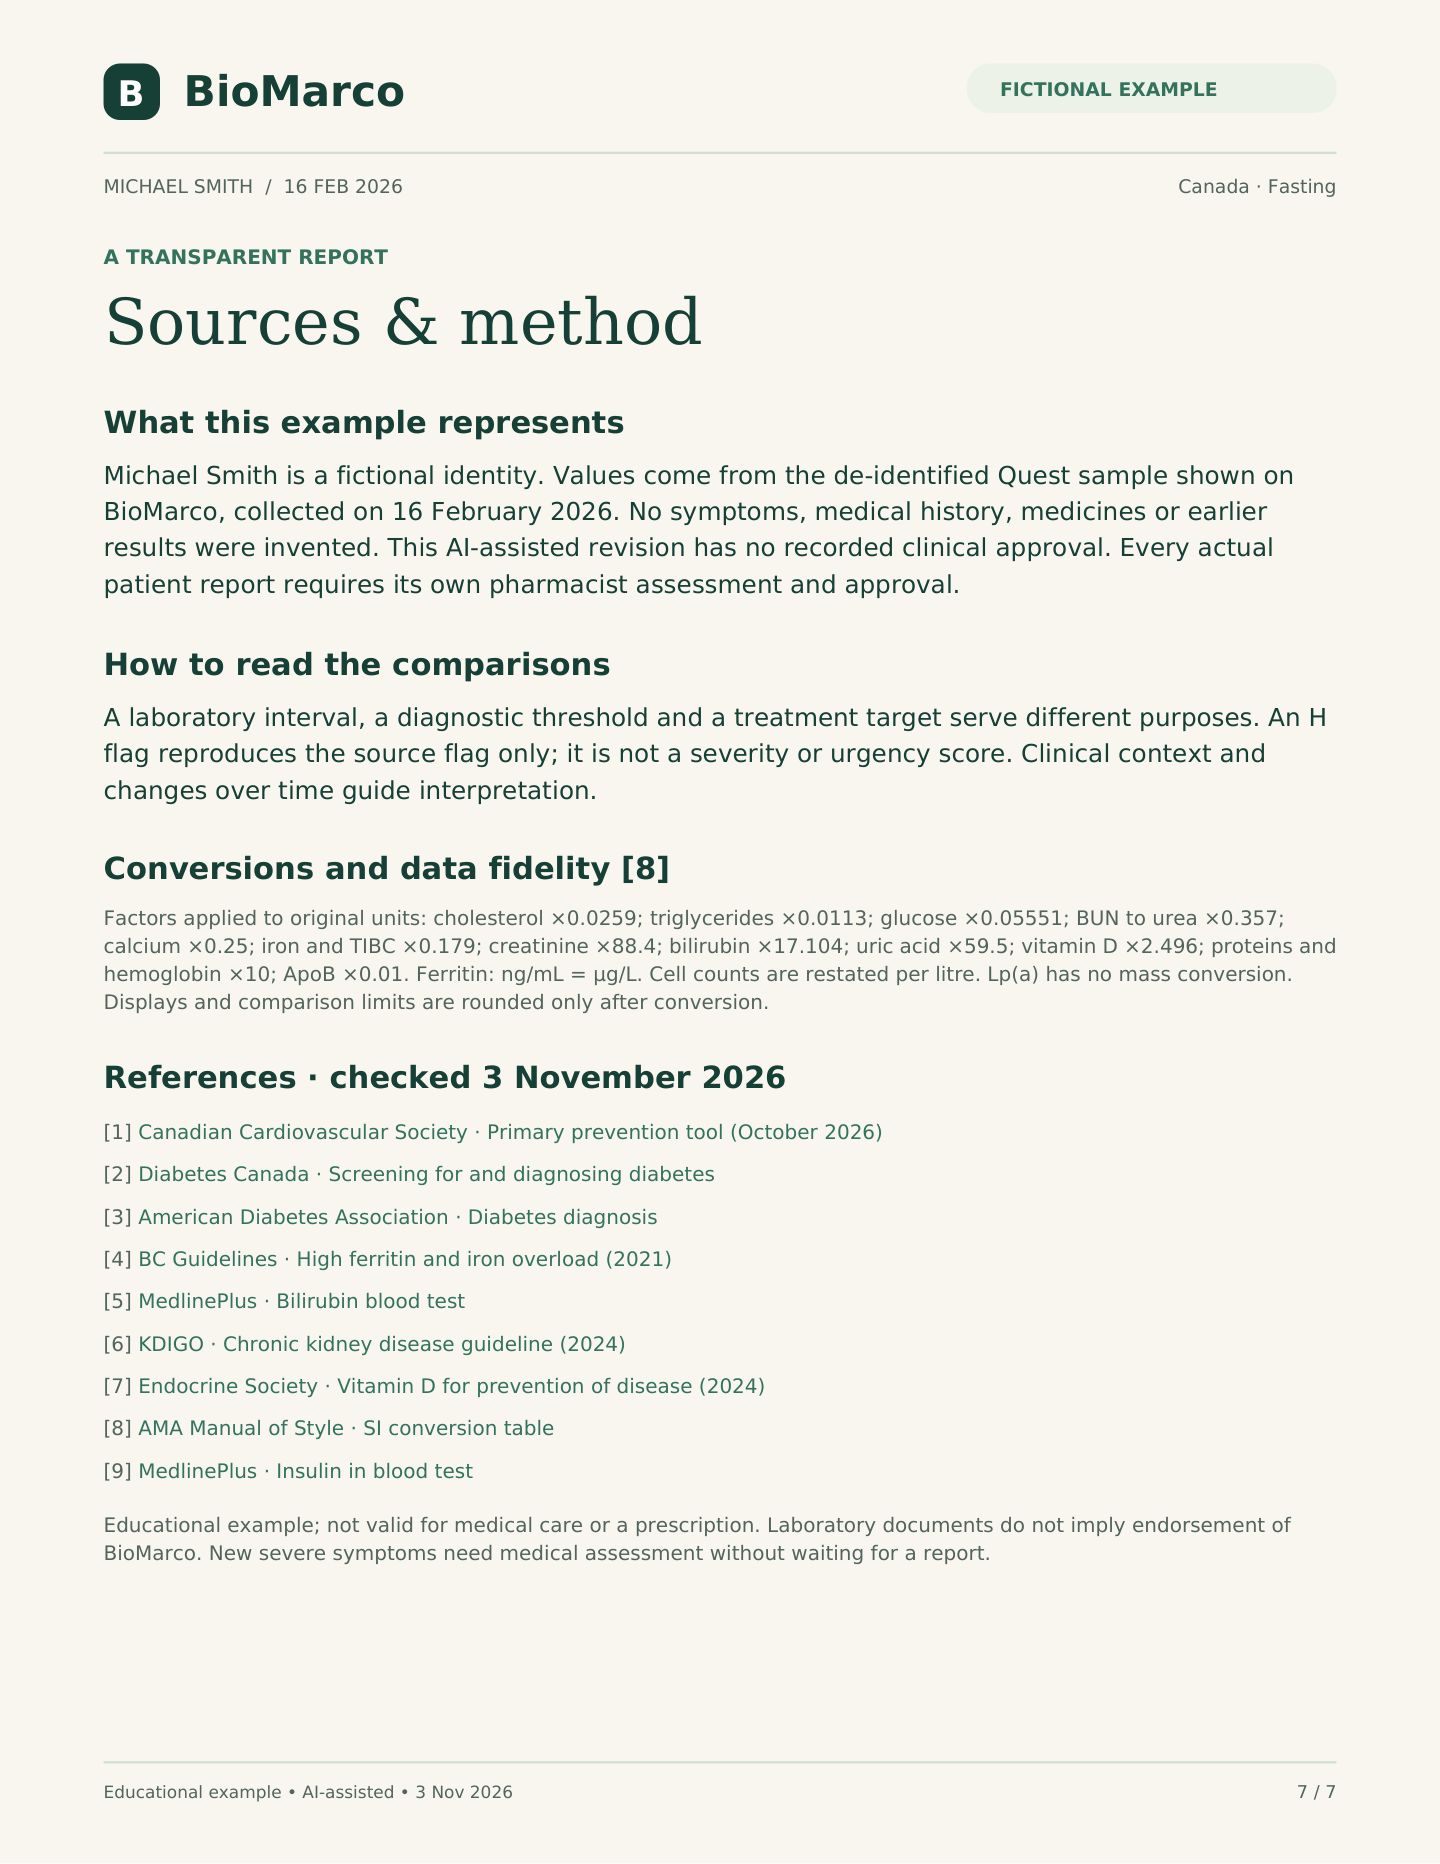
These 47 entries preserve the source numbers, units and flags. NR = not reported. Complete intervals and interpretation
notes remain in the Quest document.
Measurement
Source value
Total cholesterol
237 H mg/dL
HDL cholesterol
69 mg/dL
Triglycerides
78 mg/dL
LDL cholesterol
150 H mg/dL
Total cholesterol / HDL
3.4
Non-HDL cholesterol
168 H mg/dL
ApoB
123 H mg/dL
Lipoprotein(a) · Lp(a)
139 H nmol/L
hs-CRP
2.7 mg/L
Homocysteine
8.5 µmol/L
Fasting glucose
108 H mg/dL
A1c
5.7 H %
Insulin
6.3 µIU/mL
Iron
170 µg/dL
Iron-binding capacity (TIBC)
317 µg/dL
Transferrin saturation
54 H %
Ferritin
248 ng/mL
Urea nitrogen (BUN)
16 mg/dL
Creatinine
0.99 mg/dL
eGFR
89 mL/min/1.73 m²
BUN / creatinine ratio
NR
Sodium
141 mmol/L
Potassium
4.2 mmol/L
Chloride
103 mmol/L
Measurement
Source value
Carbon dioxide
27 mmol/L
Calcium
9.5 mg/dL
Total protein
7.2 g/dL
Albumin
4.5 g/dL
Globulin
2.7 g/dL
Albumin / globulin
1.7
Total bilirubin
1.3 H mg/dL
Alkaline phosphatase (ALP)
49 U/L
AST
24 U/L
ALT
23 U/L
GGT
48 U/L
Uric acid
5.5 mg/dL
Vitamin D · 25-OH, total
41 ng/mL
White blood cells
7.1 10³/µL
Red blood cells
5.31 10⁶/µL
Hemoglobin
16.2 g/dL
Hematocrit
49.2 %
MCV
92.7 fL
MCH
30.5 pg
MCHC
32.9 g/dL
RDW
12.7 %
Platelets
283 10³/µL
Mean platelet volume
10.5 fL
B
BioMarco
FICTIONAL EXAMPLE
MICHAEL SMITH / 16 FEB 2026
Canada · Fasting
A TRANSPARENT REPORT
Sources & method
Educational example • AI-assisted • 3 Nov 2026
7 / 7
What this example represents
Michael Smith is a fictional identity. Values come from the de-identified Quest sample shown on
BioMarco, collected on 16 February 2026. No symptoms, medical history, medicines or earlier
results were invented. This AI-assisted revision has no recorded clinical approval. Every actual
patient report requires its own pharmacist assessment and approval.
How to read the comparisons
A laboratory interval, a diagnostic threshold and a treatment target serve different purposes. An H
flag reproduces the source flag only; it is not a severity or urgency score. Clinical context and
changes over time guide interpretation.
Conversions and data fidelity [8]
Factors applied to original units: cholesterol ×0.0259; triglycerides ×0.0113; glucose ×0.05551; BUN to urea ×0.357;
calcium ×0.25; iron and TIBC ×0.179; creatinine ×88.4; bilirubin ×17.104; uric acid ×59.5; vitamin D ×2.496; proteins and
hemoglobin ×10; ApoB ×0.01. Ferritin: ng/mL = µg/L. Cell counts are restated per litre. Lp(a) has no mass conversion.
Displays and comparison limits are rounded only after conversion.
References · checked 3 November 2026
[1] Canadian Cardiovascular Society · Primary prevention tool (October 2026)
[2] Diabetes Canada · Screening for and diagnosing diabetes
[3] American Diabetes Association · Diabetes diagnosis
[4] BC Guidelines · High ferritin and iron overload (2021)
[5] MedlinePlus · Bilirubin blood test
[6] KDIGO · Chronic kidney disease guideline (2024)
[7] Endocrine Society · Vitamin D for prevention of disease (2024)
[8] AMA Manual of Style · SI conversion table
[9] MedlinePlus · Insulin in blood test
Educational example; not valid for medical care or a prescription. Laboratory documents do not imply endorsement of
BioMarco. New severe symptoms need medical assessment without waiting for a report.